
New trading engine, higher yield
April 6, 2025
Automatic Buy Strategy
April 27, 2025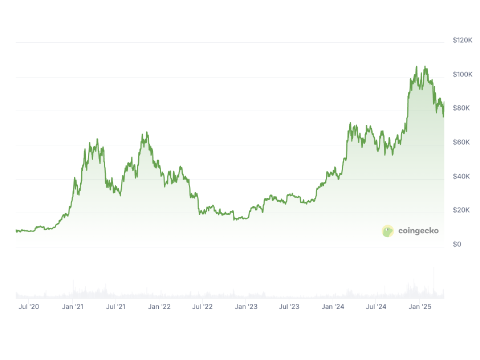
The Bitcoin price cycle is a fascinating phenomenon that has shown repeating patterns of growth, spikes, and corrections since its inception in 2009. This cycle is largely influenced by Bitcoin’s monetary structure, particularly the halving events that occur every four years and halve the miner reward, thereby reducing the new supply of Bitcoin. Here is an overview of the historical price development and underlying dynamics.
In its early years (2009-2010), Bitcoin had virtually no value. It was traded mainly among hobbyists, with a first recorded price of $0.09 in July 2010 on early platforms such as Mt. Gox. The first significant price increase occurred in 2011, when Bitcoin peaked at $31.90 in June. This increase was driven by early adoption and speculative interest, but was followed by a sharp decline to around $2, illustrating the volatility of a still immature market.
The 2013 cycle marked a broader breakthrough. In April, the price rose to $266, fueled by increased media attention and economic uncertainty, such as the banking crisis in Cyprus. Later that year, in November, Bitcoin reached a new all-time high (ATH) of $1,177. The rapid rise attracted global attention, but was followed by a correction to $200 following the 2014 collapse of Mt. Gox, the largest Bitcoin exchange at the time. This event underscored the risks of central points of failure in a decentralized system.
The next major cycle occurred in 2017. After a period of consolidation, Bitcoin began to rise in 2016, helped by that year’s halving and the rise of initial coin offerings (ICOs). In December 2017, the price peaked at $19,764, driven by retail investors and speculative mania. A subsequent correction brought the price back to around $3,200 in 2018, confirming a pattern of post-peak consolidation.
The 2020-2021 cycle was marked by institutional adoption and macroeconomic factors such as low interest rates and inflation concerns. After the 2020 halving, Bitcoin began to climb, reaching an ATH of $69,000 in November 2021. Major companies such as Tesla and MicroStrategy invested in Bitcoin, boosting confidence. However, another decline followed, reaching a low of around $17,000 in 2022, amid rising interest rates and the collapse of crypto platforms such as FTX.
The most recent cycle, following the 2024 halving, saw Bitcoin reach a new ATH of $103,332 in December 2024. This rise was supported by renewed optimism, broader adoption as an asset class, and technological advancements such as improvements to the Lightning Network. As usual, a period of volatility followed, with swings typical of the market.
The Bitcoin price cycle appears to be highly correlated with the halving cycle, with price increases typically peaking 12-18 months after a halving. Factors such as supply and demand, market sentiment, technological developments, and external economic conditions play a crucial role. Historically, each cycle has seen higher highs and higher lows, indicating a long-term trend of value growth despite short-term volatility. This pattern provides insight into the dynamics of Bitcoin as a unique asset class, but predictions remain uncertain due to the complex interplay of market forces.
| Date | All-Time High Price (USD) |
|---|---|
| July 2010 | $0.09 |
| February 2011 | $1.10 |
| June 2011 | $31.90 |
| April 2013 | $266 |
| November 2013 | $1,177 |
| December 2017 | $19,764 |
| November 2021 | $69,000 |
| December 2024 | $103,332 |
